Gantt is a R package created to fast and easy designing Gantt chart for your projects. It allows you to customize it with different options like creating paths, changing colors and sizes. Package is still in development so more powerful customization options will be added in next releases.
Usage
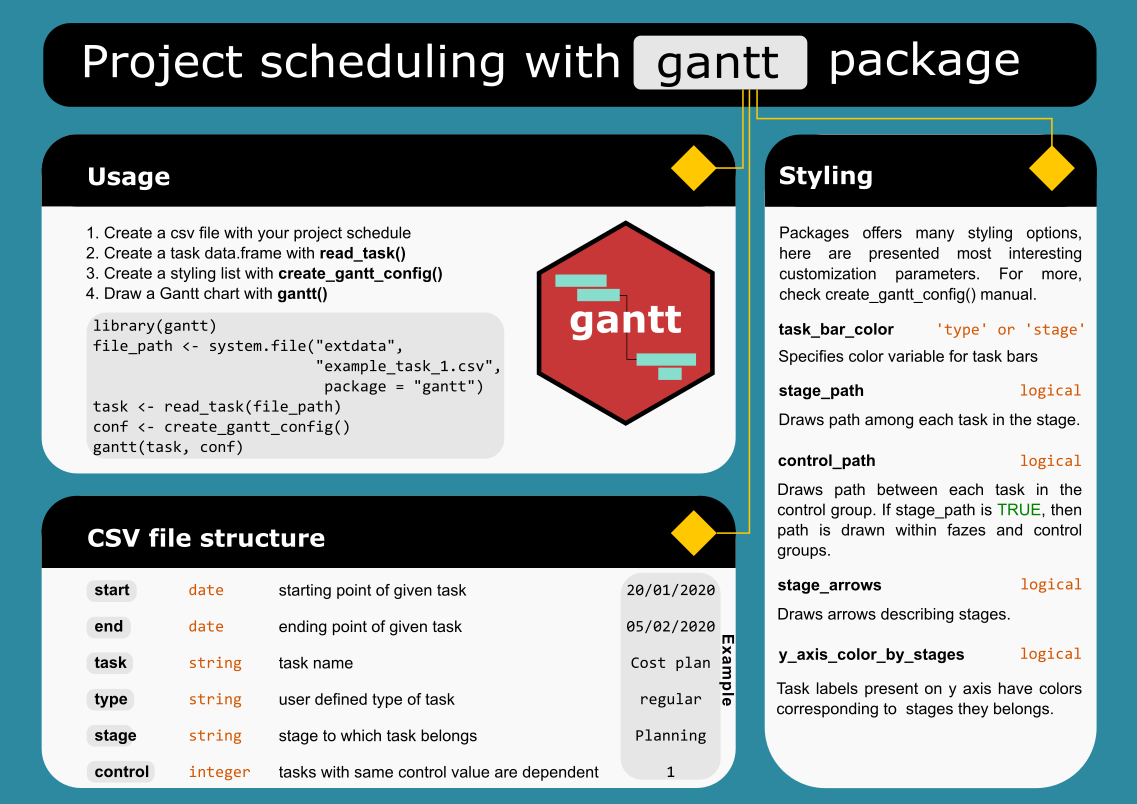
Package usage is very simple. Drawing a Gantt chart follows four steps:
- Create a csv file with your project schedule
- Create a task data.frame with read_task function
- Create a styling configuration list with create_gantt_config function
- Draw a Gantt chart with gantt function where task data.frame and styling list are parameters
Creating CSV file with tasks
Task file should contain following columns
-
startdate when given task starts -
enddate when given task ends -
taskname of task -
typestring denoting task type -
stagestring describing stage to which task belongs -
controlinteger saying which tasks are dependent of each other (same value means dependance)
Example
There is an example csv file task within the package
library(gantt)
file_path <- system.file("extdata", "example_task_1.csv", package = "gantt")
task <- read_task(file_path)
conf <- create_gantt_config()
gantt(task, conf)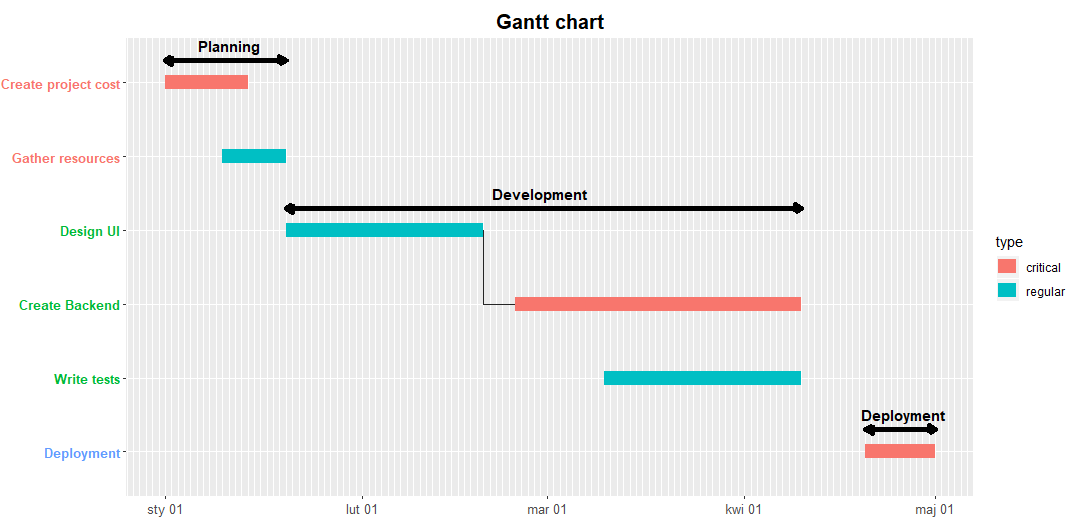
You can view example file structure from R with